|
Data management In order to answer Objective 3 set out on the previous page the monthly infection prevalence data
need to be characterised by age group, by gender and by distance from the river. If we ignore family and
assume that village populations are fairly homogeneous, then we see that the basic observational unit for
analysis contains the sums of recorded negative and positive diagnoses in any one of the month x location
x age group x gender subclasses. At the outset, therefore, it might have been sensible to prepare
the recording sheet for each family with members listed in age x gender group order so that the
summations for each group can be done by hand and added to the recording sheets. A lot of time
was spent entering the data for each member of each family into a laptop;
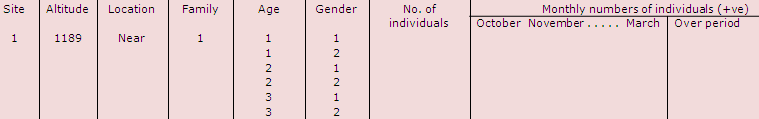
this proved not to be necessary as individual values were not used in the analysis. The above table illustrates how total values for each family by location, age and gender and month might instead have been entered and stored into the computer. An additional column has been added to the recording sheet to show, for example, how numbers of positive cases recorded over the period can also be calculated. Unfortunately, by the time it was realised that the monthly information by age group and gender was needed as well as the total values, the individual recording sheets had been lost. Having entered the data into the computer it is then necessary to sum up the results for the four families within each location to produce the data contained in CS14Data2, which represent the basic observational units (see previous page) needed for the analysis. However, for the reasons mentioned above, only the numbers of positive test results recorded over the 6-month period are included in this file, not the separate values for each month. |
![]()
![]()
![]()