Data management
 GenStat can
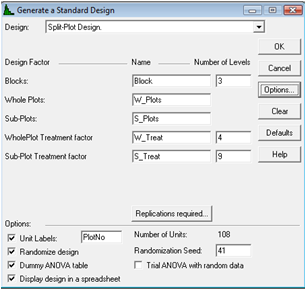
be used to design the experimental layout for Study 1 and produce a corresponding recording sheet by using Stats → Design →
Generate a Standard Design... and putting appropriate numbers for blocks (or replicates) (namely 3) and whole plot and
subplot treatments (namely 4 for dates of planting and 9 for the nine landrace x fertiliser levels. GenStat can
be used to design the experimental layout for Study 1 and produce a corresponding recording sheet by using Stats → Design →
Generate a Standard Design... and putting appropriate numbers for blocks (or replicates) (namely 3) and whole plot and
subplot treatments (namely 4 for dates of planting and 9 for the nine landrace x fertiliser levels.
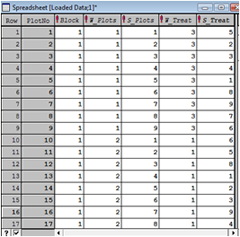
By clicking the Options button on the right hand side and making 'plot labels' sequential numbers a spread sheet
similar to that below with 'treatments' randomised to plots can be obtained.
 Now select
the first nine rows (Block 1 W_Plots 1), click Spread → Sort... and sort PlotNo into ascending order, ticking the box to 'Place
sorted rows at bottom of sheet'. This simply has the effect of moving these rows to the bottom. The nine rows for Block 1,
W_Plots 2 are now at the top. Select these but this time sort PlotNo into descending order so that PlotNo is in reverse
order 18, 17, 16, 15, 14, 13, 12, 11, 10. These rows again appear at the bottom of the file. Continue throughout the file
until PlotNo 1 is back at the top. Now select
the first nine rows (Block 1 W_Plots 1), click Spread → Sort... and sort PlotNo into ascending order, ticking the box to 'Place
sorted rows at bottom of sheet'. This simply has the effect of moving these rows to the bottom. The nine rows for Block 1,
W_Plots 2 are now at the top. Select these but this time sort PlotNo into descending order so that PlotNo is in reverse
order 18, 17, 16, 15, 14, 13, 12, 11, 10. These rows again appear at the bottom of the file. Continue throughout the file
until PlotNo 1 is back at the top.
The reason for doing this is discussed on the next page.
|
 GenStat can
be used to design the experimental layout for Study 1 and produce a corresponding recording sheet by using Stats → Design →
Generate a Standard Design... and putting appropriate numbers for blocks (or replicates) (namely 3) and whole plot and
subplot treatments (namely 4 for dates of planting and 9 for the nine landrace x fertiliser levels.
 Now select
the first nine rows (Block 1 W_Plots 1), click Spread → Sort... and sort PlotNo into ascending order, ticking the box to 'Place
sorted rows at bottom of sheet'. This simply has the effect of moving these rows to the bottom. The nine rows for Block 1,
W_Plots 2 are now at the top. Select these but this time sort PlotNo into descending order so that PlotNo is in reverse
order 18, 17, 16, 15, 14, 13, 12, 11, 10. These rows again appear at the bottom of the file. Continue throughout the file
until PlotNo 1 is back at the top.