 Statistical modelling Statistical modelling
Dry corm weight
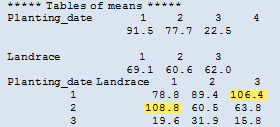
From the section of the table of means shown alongside it can be seen that the highest yields for Landrace 2 (Mgingqeni) and 3 (Pitshi)
occurred when planted in October. In contrast, Landrace 1 (Dumbe-Dumbe) performed better when planting was delayed
until November (Planting date 2). Its yield then was similar to that of Pitshi planted in October.
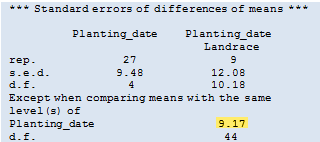
We can compare these mean values using standard errors of differences to form a t-test. As the 95% value of t is approximately 2 we can multiply the s.e.d.s by 2 to get a close idea of the statistical significance of individual differences. Thus, 2 x 9.17 = 18.34 gives a measure of the least significant difference (L.S.D) that needs to occur between two landrace means planted on the same date for them to be significantly
different (P<0.05).
 When planted in October the yield for Pitshi is 27.6 and 17.0 g higher than the yields for the other two landraces. We can thus say that the yield for Pitshi. when planted in October, is significantly higher
than that for Dumbe-Dumbe (P<0.05) but not for Mgingqeni. By using the 99% t-value we can similarly calculate
the L.S.D. at the P<0.01 level of significance. When planted in October the yield for Pitshi is 27.6 and 17.0 g higher than the yields for the other two landraces. We can thus say that the yield for Pitshi. when planted in October, is significantly higher
than that for Dumbe-Dumbe (P<0.05) but not for Mgingqeni. By using the 99% t-value we can similarly calculate
the L.S.D. at the P<0.01 level of significance.
Note that the s.e.d and d.f. for comparing means within the table at different levels of planting date are different from those used for the same planting date. The d.f. value of 10.18 is calculated by a formula that takes into
account the two residual degrees of freedom (namely 4 and 44) form the different strata in the analysis of variance.
|