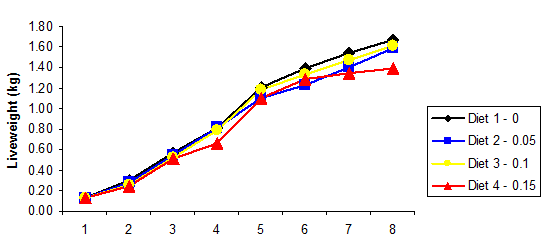
Exploration and descriptionMean weekly weights and feed conversion efficiencies (calculated as weight gained over the previous week divided by the feed consumed) were plotted for each diet against age of chicken in weeks. Weight gainThe line graph depicts the performance of the chickens with respect to weight gain. It can be seen that the observed trends were similar suggesting that inclusion of different rates of the Saccharomyces cerevisiae did not affect weight gain. Indeed between weeks 6 and 8 those chickens receiving the highest level of spent yeast grew on average the least.
|
![]()
![]()
![]()