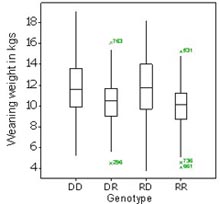
 Exploration & description A box plot by genotype (Graphics → Boxplot...) and completing the dialog box reveals that the lambs born to Dorper dams (the first and third boxes) appear to have a generally higher weaning weight than those born to Red Maasai dams (the second and fourth boxes). However, weaning weights within genotypes appear to be fairly normally distributed, as indicated by the relative positions of the medians within the respective boxes that contain half the data. The numbers 763, 531, 296, 661 and 736 indicated beyond the extremities of the vertical lines point to the record numbers in CS3Data that are 'outliers'. |
|
![]()
![]()
![]()