|
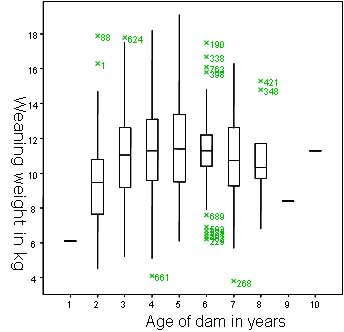
Exploration & description This box plot illustrates the association between weaning weight and the age of a lamb's dam. There are more `outliers' shown in this diagram than the one for genotype. This is probably because the variation among genotypes is not accounted for in this series of boxplots. The plot shows that an offspring's weaning weight appears to increase as a dam increases in age from 2 to 5 years and to decrease from 6 years onwards. We can fit age as a factor with seven levels. Alternatively, we may be able to represent the relationship, either by a polynomial curve, possibly up to order 3 (cubic), or by amalgamating some of the ages by using fewer discrete subclasses (e.g. 2, 3-4, 5-6, 7-8 years). These alternatives are considered later. For each age the distributions of lamb weaning weights are also fairly normal as revealed by the box plot. The spread of the weights is similar for all age of a dam except possibly that for lambs born to dams aged 6 years. |
|
![]()
![]()
![]()