|
Statistical modelling
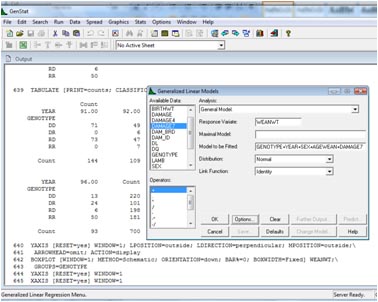
We can fit the model by using the dialog box shown below
obtained by Stats →
Regression Analysis →
Generalized Linear Models... Then by clicking the
Options button, then ticking Accumulated, an analysis of
variance is shown which gives the sums of squares accounted for by each parameter in the
model.
|
|
|
***** Regression Analysis *****
Response variate: WEANWT
Fitted terms: Constant
+ GENOTYPE + YEAR +
SEX + AGEWEAN + DAMAGE7
*** Estimates of parameters
***
|
Parameter
|
estimate
|
s.e.
|
t
|
|
Constant
|
4.327
|
0.883
|
4.90
|
|
GENOTYPE DR
|
-0.493
|
0.306
|
-1.61
|
|
GENOTYPE RD
|
-0.408
|
0.222
|
-1.84
|
|
GENOTYPE RR
|
-1.008
|
0.272
|
-3.71
|
|
YEAR 92
|
-1.551
|
0.308
|
-5.03
|
|
YEAR 93
|
-1.228
|
0.291
|
-4.22
|
|
YEAR 94
|
-2.983
|
0.388
|
-7.69
|
|
YEAR 95
|
-3.258
|
0.346
|
-9.40
|
|
YEAR 96
|
-2.333
|
0.423
|
-5.51
|
|
SEX M
|
0.482
|
0.170
|
2.84
|
|
AGEWEAN
|
0.07058
|
0.00886
|
7.97
|
|
DAMAGE7 3
|
1.833
|
0.319
|
5.75
|
|
DAMAGE7 4
|
2.741
|
0.331
|
8.28
|
|
DAMAGE7 5
|
2.742
|
0.322
|
8.52
|
|
DAMAGE7 6
|
2.322
|
0.382
|
6.07
|
|
DAMAGE7 7
|
1.754
|
0.462
|
3.79
|
|
DAMAGE7 >=8
|
1.405
|
0.647
|
2.17
|
*** Accumulated analysis of variance ***
|
Change |
d.f. |
s.s. |
m.s. |
v.r. |
|
+GENOTYPE |
3 |
570.427 |
190.142 |
38.68 |
|
+YEAR |
5 |
735.646 |
147.129 |
29.93 |
|
+SEX |
1 |
59.013 |
59.013 |
12.00 |
|
+AGEWEAN |
1 |
336.792 |
336.792 |
68.51 |
|
+DAMAGE7 |
6 |
445.076 |
74.179 |
15.09 |
|
Residual |
683 |
3357.495 |
4.916 |
|
| |
|
|
|
|
|
Total |
699 |
5504.450 |
7.875 |
|
|
|