Statistical modellingStudy A We can also take the opportunity to demonstrate methods of principal component and cluster analysis to attempt to characterise the different accessions (see Van de Wouw et al. (1999)). We shall use the morphological spreadsheet contained in CS5Data2. Principal components Using Stats → Multivariate Analysis → Principal Components… and clicking the Options… button in the dialog box to ensure that Number of Dimensions is 2 (to indicate we are only interested in the first two components), to tick Scatter Plot Matrix of Principal Component Scores and to enter 'Code' into the Display Labels window so that each point is identified by its accession code (note that Code must be declared as text), we obtain the scatter plot shown on the next page.
The GenStat output (not shown here) also reports the first component to have accounted for 32% and the second component 17% of the total variation expressed amongst the individual variables. |
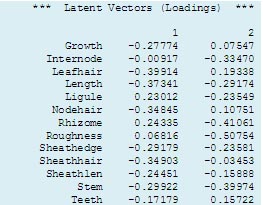 The output alongside shows the two principal components and their vector loadings (or coefficients). We can see that Growth, Length and Stem contribute high negative weights to the first principal component together with variables describing the extent of hairiness. In contrast, Ligule and Rhizome have slightly lower weightings but in the opposite direction. Highest weightings for the second component are provided by Roughness, Rhizomes, Stem and Internode. It is often possible to interpret a principal component biologically. Thus, the first component tends to separate accessions on the basis of size and degree of hairiness.
![]()
![]()
![]()