Data managementNext, we need to group the data into five lactation phases, four of 7 week
intervals and a remainder, so that we can later analyse the association between
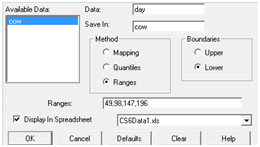
milk yield and concentrate fed at different phases of lactation. We do this using
Data
We save this file as a GenStat worksheet in CS6Data2. This file provides the basis for fitting Wood's model in Statistical modelling to calculate the average relationship between milk yield and day of lactation. |
![]()
![]()
![]()