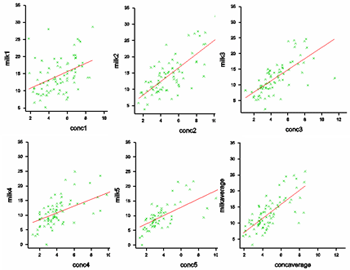
Statistical monitoring / Concentrates and milk yieldHere we use the data that have been arranged in CS6Data3 (as described under Data management) and fit linear regressions for each of the five phases of lactation and for the five phases combined. Once again the scales for each of the graphs have been modified so that the same scale is used for each graph. |
||
|
Apart from a few outliers in the bottom right hand corners of the graphs for phases 4 and 5 of lactation (x-axis: 'conc4' and conc5'), there is generally a good association between concentrate fed and milk yield produced. The poorest association is possibly during the first seven weeks of lactation ('conc1'), namely before peak yield is reached. |

|
|