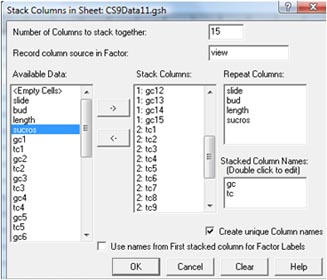
Data managementData file preparation for Experiment 1 Data obtained for each of the 15 fields of view in a slide are stored across the spreadsheet (CS9Data1). In order to analyse the data it is first necessary to put the 15 columns of germination and total counts (gc1, tc1,…, gc15, tc15) into two columns (gc and tc) and to create a new column for field of view (view) with levels from 1 to 15. The GenStat stack command (Spread → Manipulate → Stack…) can be used to do this (see below - note 'Stacked Column Names' edited). The percentage germination (pgerm) was then calculated (Spread → Calculate → Column...) as (gc/tc)x100 (put to 2 decimal places using (Spread → Column → Attributes/Format…) and the new spreadsheet stored as a file CS9Data1a. Column names in this Excel spreadsheet were then changed to those shown in CS9Doc1a.
|
