|
Exploration & description A few outliers are indicated in green and red, especially at the zero sucrose concentration, but the number would appear insignificant in view of the large number of data points. Nevertheless, it would be worth checking the records for inaccuracy in data entry. Both graphs depict a parabolic pattern in germination rate with increasing sucrose concentration. 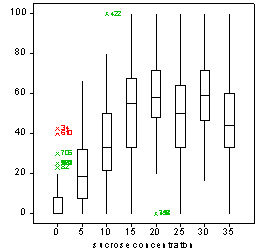 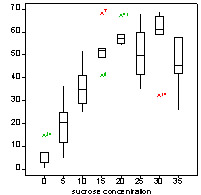
|
![]()
![]()
![]()