|
Statistical modelling/Multiple regression analysis |
||
|
By inserting this value in the regression equation we can calculate that the maximum percentage germination (achievable at this concentration) is 57%. This sucrose concentration was applied in Experiment 2 to compare germination and viability rates. Although 6x15 = 90 records were collected in Experiment 2, the appropriate experimental unit for comparing germination and viability rates is bud, not field of view. The 15 field of view measurements are simply replicates for the same bud. There are just six buds for comparison so that a formal statistical analysis on this sample size is not appropriate. The best that we can do is to plot individual viability rates in CS9Data2a against corresponding germination rates (Graphics → Create Graph...→ 2D Scatter Plot) and observe the pattern. We can see that there is no correlation between viability and germination rate. |
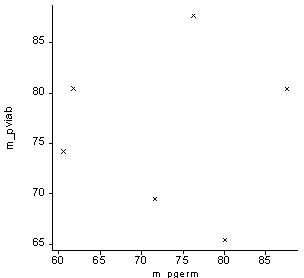
Interestingly mean germination rate at the sucrose concentration applied was higher than in Experiment 1. |
|
![]()
![]()
![]()