|
Exploration and description River variablesWe begin by investigating overall correlations among the various variables in CS14Data1.
Stats
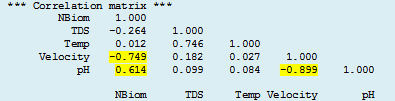
There are high correlations between the number of Biomphalaria snails (NBiom) and water flow velocity (-0.749) and between NBiom and pH (0.614). Water flow velocity and pH are in turn highly correlated (-0.899) indicating a strong association between them. We now need to look at plots of the individual points to see the patterns of association between
pairs of variables. We can do this by Graphs |
|
|