|
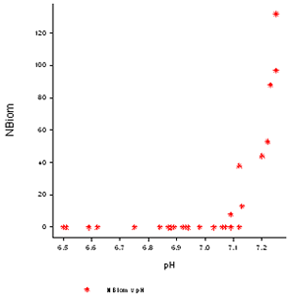
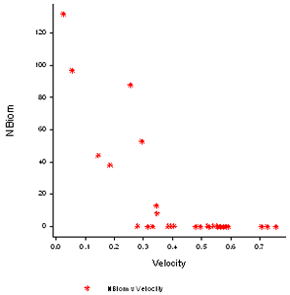
Exploration and description River variablesThe first scatter plot shows the number of Biomphalaria snails (NBiom) against pH. We can see that there is a positive association between NBiom and pH when pH is 7.1 or above. No snails were found when pH was below 7.1. The second scatter plot shows the number of Biomphalaria snails plotted against water flow velocity. The opposite pattern occurred; NBiom increased when water flow velocity decreased below about 0.4 m/s. No snails were found when velocity was 0.4 m/s or above. |
![]()
![]()
![]()