|
Statistical modelling River variablesWith 'Accumulated' ticked in the dialog box an analysis of variance table is provided showing the Changing the order in which the independent variables are introduced results in this A possible explanation for the association is that the river becomes wider and so the flow speed of the water reduces further downstream. Stable water conditions downstream would be particularly prevalent during the dry season. Such conditions would enable the snails to anchor more easily on the water vegetation. Also, as the debris carried down the river settles and rots down, so the pH of the water gradually increases. This would explain why higher numbers of Biomphalaria species of snails are associated with lower water flow rates and higher pH levels. |
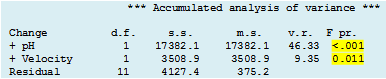 effect of adding
independent variables one by one. Thus, inclusion of pH on its own is highly significant (P<0.001) but addition of Velocity to the model is also significant (P<0.05). Note that the F value of 0.011 is the same as that for the t-value on the previous page;
this demonstrates how the F test (with one degree of freedom in the numerator) is analogous to the t test.
effect of adding
independent variables one by one. Thus, inclusion of pH on its own is highly significant (P<0.001) but addition of Velocity to the model is also significant (P<0.05). Note that the F value of 0.011 is the same as that for the t-value on the previous page;
this demonstrates how the F test (with one degree of freedom in the numerator) is analogous to the t test.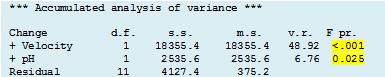 alternative version of the analysis of variance table; this shows what happens when pH is added as the second variable.
![]()
![]()
![]()