Statistical modelling
River variables
 We shall now explore further the associations between number of Biomphalaria
snails and water flow
velocity and pH measurements over the restricted range of velocity and pH values stored in CS14Data3. Using
Stats → Regression
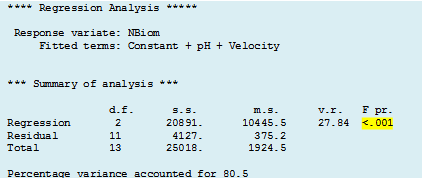
Analysis → Generalized Linear Models ... we can fit a linear regression model with the two independent variables Velocity and pH. We shall now explore further the associations between number of Biomphalaria
snails and water flow
velocity and pH measurements over the restricted range of velocity and pH values stored in CS14Data3. Using
Stats → Regression
Analysis → Generalized Linear Models ... we can fit a linear regression model with the two independent variables Velocity and pH.
From the output we can see that the regression mean square is highly significant (P<0.001) and that the model accounts for 80.5% of the variation in
Biomphalaria
numbers. This is equivalent to a multiple correlation coefficient of 0.9 (square root of 0.805).
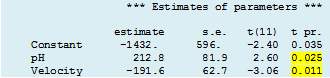 From the t-values for the parameter estimates it can be seen that both independent variables contribute significantly to the equation (P<0.05).
Another way of understanding this (see next page) is to click the Options... button in the Dialog Box and tick 'Accumulated'. From the t-values for the parameter estimates it can be seen that both independent variables contribute significantly to the equation (P<0.05).
Another way of understanding this (see next page) is to click the Options... button in the Dialog Box and tick 'Accumulated'.
We can write the regression equation as NBiom = -1432 + 213(±82)pH -192(±63)Velocity
|