|
Appendix
Human infections
The results of this analysis can be presented as shown in the table below; this is set out in the way
recommended in the Reporting Guide. The numbers of individuals shown to be sampled and infected can be found via
Stats → Summary Statistics → Summaries of Groups (Tabulation).... and clicking 'Totals' in the dialog box for N_age_gen and N_infections, respectively. Inclusion of these raw values in the table is useful; they show the size of the study so
that the reader can appreciate the practical significance of the statistical conclusions drawn.
Table: Effect of age and gender on infection rates of schistosomiasis in people living in villages along the River Kochi
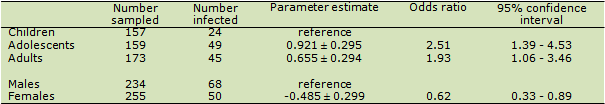
The parameter estimates in the above table are taken from the GenStat output; the odds ratio are the values shown under
'antilog of estimate'. Thus, for example, the value of 2.51 appearing for adolescents under the column headed 'antilog of estimate'
can be interpreted as the ratio of infected to non-infected adolescents divided by the ratio of infected to non-infected children.
In other words the odds of an adolescent being infected is 2.51 more likely than that of a child. The 95% confidence interval has been
calculated by hand as (antilog of the parameter estimate ± twice its standard error). Thus, the 95% confidence range for the odds ratio
for adolescents compared with children is from 1.39 to 4.53. The fact that this interval does not overlap the
value 1 means that the difference in infection rates between adolescents and children is statistically significant.
|