 Statistical modelling Statistical modelling
Plant yield (biomass)
Analysis of variance of 3-month biomass is obtained via
Stats → Analysis of variance..., then choosing General Treatment Structure
(in Randomized Blocks) for the design and entering Cultivar*Spacing*Fertiliser for the treatment structure.
It is useful to click Options and tick the cv% box to include the coefficient of variation term in addition to other values automatically displayed.
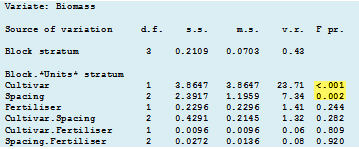
From the analysis of variance for biomass it can be seen that there are significant differences
between cultivars (P<0.001) and among spacings (P<0.01) but that addition of fertiliser had no significant effect. There are no significant interactions.
A coefficient of variation of 15.4% is displayed at the end of the GenStat output. This is not an unreasonable level of error variation for this type of experiment.
It is interesting to see how the analysis of variance command is expressed in the GenStat Input log.
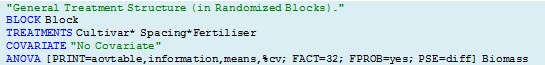
At any time the user can alter the above text, select the
five lines and click Run → Submit Selection. Sometimes this may be more efficient way of doing things than filling in the dialog box again.
|