|
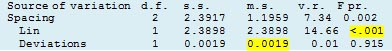
Statistical modelling Plant yield (biomass)The levels of the spacing factor (namely 5 cm, 10 cm and 15 cm) are equally spaced.
This causes an additional two lines to be included in the analysis of variance. They show that biomass is linearly related to level of spacing (P<0.001) and that this accounts for virtually all the variation caused by differences in spacing, with hardly any left in the Deviations mean square.
|
|
|
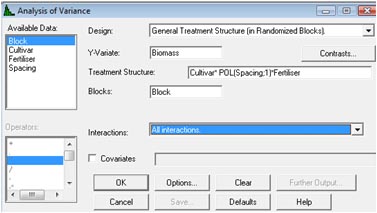 We can therefore include a contrast within the analysis of variance to test for linear or quadratic relationships.
We do this by clicking the Contrasts... box in the dialog box shown alongside and entering Spacing for the 'Contrast Factor'.
We can therefore include a contrast within the analysis of variance to test for linear or quadratic relationships.
We do this by clicking the Contrasts... box in the dialog box shown alongside and entering Spacing for the 'Contrast Factor'.