|
Statistical modelling Plant yield (biomass)The table of means shows that biomass yield was lower for Umtata (Cultivar C0) than for Kranskop (Cultivar C1). This is possibly related to
the
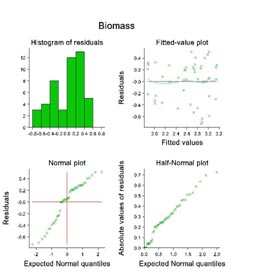
It is worth clicking Options... in the analysis of variance dialog box and then Residual Plots to examine the distributions of residuals. The shapes of both the histogram and the normal and half-normal plots of residuals (which should lie on a 45o line through the origin) indicate some non-normality amongst the residuals. The scatter plot of residuals suggests a possible slight increase in variation with increasing value. However, there are no extreme residual values displayed and it is difficult to think of a reason for these patterns. Analysis of variance is a robust procedure and can often deal satisfactorily with departures from normality, and we shall assume that it does in this case. |
 different growth habits of the two cultivars. Umtata has a determinate growth habit (flowers once) whereas Kranskop has an indeterminate
growth habit (flowers continuously). It can be calculated from the
values below that mean biomass yield per plot decreased linearly with increased spacing by an average of 0.27 kg per plot per 5 cm increase in spacing.
different growth habits of the two cultivars. Umtata has a determinate growth habit (flowers once) whereas Kranskop has an indeterminate
growth habit (flowers continuously). It can be calculated from the
values below that mean biomass yield per plot decreased linearly with increased spacing by an average of 0.27 kg per plot per 5 cm increase in spacing. 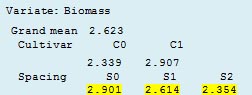
![]()
![]()
![]()