|
Statistical modelling Plant heightPlant height was measured weekly over four weeks from 15 plants selected at random. Although emergence by week 2 was just 50% it had reached 100% by week 4. There were no significant differences in rates of emergence among cultivars or levels of spacing.
However, this method does not fulfill the requirements for a regular split-plot design since, as a subplot, week, being a repeated measure, is a regular measurement in time and so cannot be considered as a random component. One way to get around this is to think of the analysis in terms of a 'split-plot in time' model. This design is different from that of a conventional split-plot design and needs a degree of caution in the interpretation of the analysis of variance. A simple approach that can sometimes be applied is to replace the degrees of the residual for the sub-plot part of the analysis by the main plot residual degrees of freedom and to recalculate the F-probabilities for week and its interactions with other factors. |
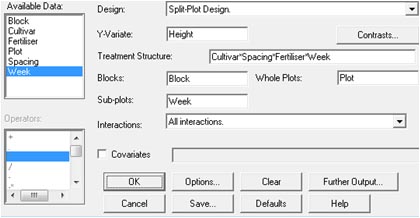 To analyse all the weekly data together we need to create a dialog box for a
Split-Plot Design via Stats → Analysis of Variance...
with week playing the role both as a factor and a sub-plot.
To analyse all the weekly data together we need to create a dialog box for a
Split-Plot Design via Stats → Analysis of Variance...
with week playing the role both as a factor and a sub-plot.
![]()
![]()
![]()