|
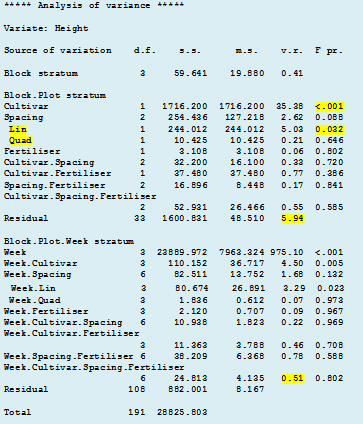
Plant heightThe analysis of variance is shown here. We have used the contrast button in the dialog box to add linear and quadratic components for spacing. Consider the main plot component of the analysis (Block.Plot stratum). Notice first the size of the residual mean square compared with that of the sub-plot stratum (6.52 times larger). A common mistake when dealing with these types of data is to analyse them as a randomised block including week as a factor in the same stratum as the others. When this is done the residual mean square becomes a composite of the two residual means squares to the right, resulting in faulty conclusions about the statistical significance of main plot treatment effects. The analysis of variance shows significant differences in mean plant height between cultivars (P<0.001) and also a significant linear effect of spacing (P<0.05). Note, however, that we may look at these results differently after we have examined other assumptions of analysis of variance. |
 Statistical modelling
![]()
![]()
![]()