 Reporting Reporting
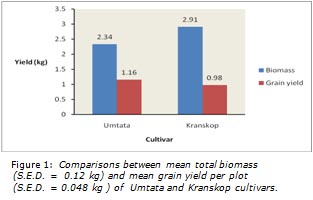
Alternatively, results can be presented as figures. These column charts display the yields of the two
cultivars in terms of total biomass and grain yield side by side. The first figure demonstrates visually
how Umtata provided a higher grain yield than
Kranskop despite producing a lower total biomass. Note that S.E.D.s have been included within the title.
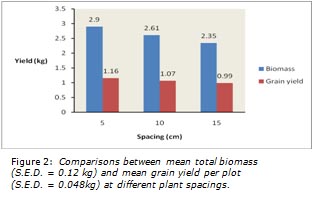
The second figure shows the effect of reducing the spacing between plants on biomass and grain yield.
 Results presented in scientific publications should not be duplicated. The author needs to decide which form of presentation is better – as a table or a figure. Results presented in scientific publications should not be duplicated. The author needs to decide which form of presentation is better – as a table or a figure.
|