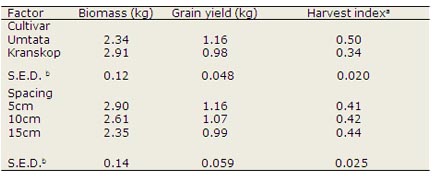
ReportingWe shall here describe how to present results of analysis of the data for yield per plot. When there are no significant interactions mean results can be readily presented in the form of a simple table of overall means.
The following table lists the two factors that had an effect on yield down the left hand side and presents the variables of interest across the top.
Notice that for each variable a standard error (S.E.D.) is included to compare the differences between two means. Mean values are presented with a
suitable number of significant figures and S.E.D.s have either the same number of significant decimal places or, where these are inadequate, one more.
Presenting the results in this way makes it easy for the reader to judge both the biological and statistical significance of the mean differences between
cultivars and spacings. Note that it is not necessary to introduce indications of statistically significant effects within the table (e.g. superscript letters).
Note also how the title fully describes the contents of the table.
|
![]()
![]()
![]()