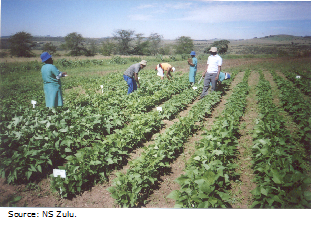
Questions to be addressedIn this case study we shall discuss:
We shall also describe the meaning and use of contrasts to investigate the patterns expressed by variations in yield resulting from the three levels of spacing used in the experiment. Plant growth was measured weekly. Analysis of weekly values together results in a split-plot in time model. We shall discuss the difference between a conventional split-plot experiment and a split-plot in time experiment. Finally we shall give some tips for presenting results from factorial experiments. |
 be investigated simultaneously.