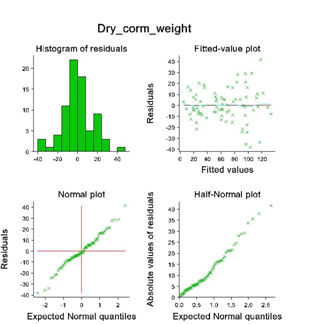
Exploration and descriptionWe need to check other analysis of variance assumptions. By rerunning the analysis of variance and then clicking Options on the GenStat screen and then Residual Plots... we obtain the graphs alongside.
However, the normal plots are reasonably linear at 45o, and so we shall show the results of analysis of variance based on the raw data.
|
 We can see that the distribution is a little scattered, though essentially normal and that the residual
values tend to increase with increasing size of observation. This reflects the differences in variation between
planting dates 1 and 2 and planting date 3 observed earlier.