 Exploration and descriptionNumbers of cormsApplying similar methods of analysis to measurements of numbers of corms per plot we find that the number recorded for subplot 55 is four times its standard error. Three other observations are also listed but their deviations are smaller. Again no reason could be found for this anomaly and so this measurement was replaced by an * in the 'Edited data' spreadsheet in CS16Data1a. Running the analysis of variance again and producing the residual
plots we see that the histogram shows signs of skewness to the right and that the normal
plots are slightly curved and deviate from the 450 line. Measurements of counts, such
as Calculating the variable sqrt_corms (Spread → Calculate → Column... and rerunning the analysis of variance we can see that the transformed data fit better the assumption of normality. For number of corms we shall therefore analyse the transformed values. |
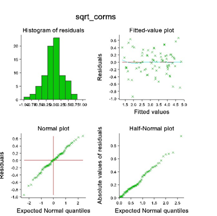 in this case, number of corms tend to follow a Poisson distribution. A square root transformation is likely to
produce a distribution closer to normality.
in this case, number of corms tend to follow a Poisson distribution. A square root transformation is likely to
produce a distribution closer to normality.
![]()
![]()
![]()