 Statistical modelling Statistical modelling
Numbers of corms
From the table of means we observe that the numbers of corms per plot deceases from square
root means of 3.961 to 2.045 from planting dates 1 to 3. Landraces Pitshi and Mgingqeni produced more corms than Dumbe-Dumbe.
 Comparing landrace means for each planting date we see that Pitshi performed as well as Mgingqeni
in October but became less productive when planted later. Comparing landrace means for each planting date we see that Pitshi performed as well as Mgingqeni
in October but became less productive when planted later.
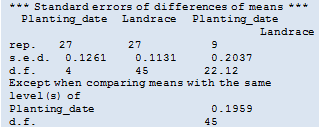
Multiplying standard errors of differences by 2 we can calculate approximate 95% L.S.Ds, namely 0.252 among planting date means, 0.226 among landrace means and 0.392 among landrace means at the same planting date. Applying these L.S.D.s to the table of means it can be seen that numbers of corms significantly decreased from planting date 1 to 2 to 3 and that Dumbe-Dumbe (Landrace 1) produced significantly fewer corms than Mgingqeni and Pitshi when planted in October and November. However, in
December only Mgingqeni produced a significantly higher number of corms.
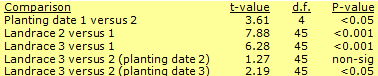 By calculating t-values: By calculating t-values:
(t = [|mean1 - mean2|/s.e (mean1 - mean2)])
we can calculate exact significance levels for pairs of
comparisons as illustrated in the table.
Finally, the coefficient of variation is 13.1%; this is a satisfactory value.
|