ReportingDry corm weight
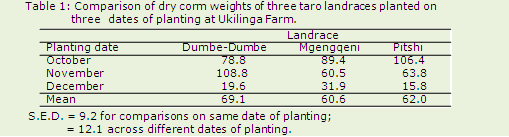
Because of the significant interaction between landrace and planting date it is necessary to present the results as a 2-way table. Notice that two S.E.D values are shown in the footnote. Multiplying each of these values by 2 gives approximate L.S.D.s to apply to differences between pairs of means. For example, the approximate L.S.D. for comparing means on the same line is 2 x 9.2 =18.4. Some authors feel they need to include superscripts to indicate statistical significance between means. This (as discussed in the Reporting Teaching Guide) is unnecessary for a table as simple as this. The differences in mean values are pretty clear. One also needs to remember that there are differences in variation between planting dates 1 & 2 and 3, as shown earlier, so that the S.E.D. quoted in the table is an average and therefore needs to be interpreted with a degree of caution. Therefore, the S.E.D. value of 0.11 as shown can be used for any comparison within the body of the table. |
 Having completed the analysis we now need to see how to present the data. There are two ways,
either with a table or with a graph. Here we illustrate how a table should be prepared.
The table shows mean dry corm weight by landrace and planting date.
Having completed the analysis we now need to see how to present the data. There are two ways,
either with a table or with a graph. Here we illustrate how a table should be prepared.
The table shows mean dry corm weight by landrace and planting date. ![]()
![]()
![]()