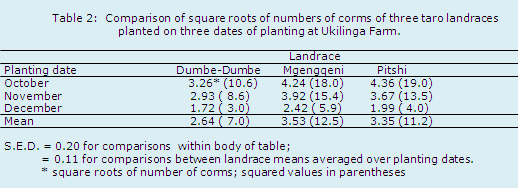
ReportingNumbers of cormsThe following table shows results for corm numbers. Since the statistical analysis has been carried out on the square roots of corm numbers an extra value is included in parentheses. This is the square of the mean square root value. One could alternatively calculate 95% confidence limits for each mean on the square root scale and then present squared limits to give indications of the likely ranges on the original scale. Statistical comparisons, however, need to be applied to the square roots. Note that on this occasion (since whole-plot and sub-plot mean squares were similar - see earlier analysis of variance table) calculated values for the two S.E.D.s for comparisons within the table are the same to two decimal places. Therefore, the S.E.D. value of 0.11 as shown can be used for any comparison within the body of the table.
|
![]()
![]()
![]()