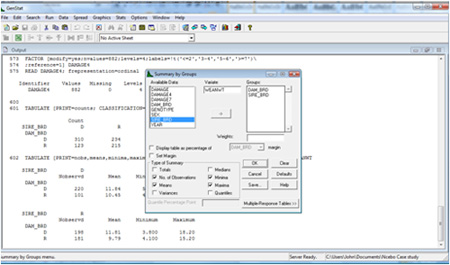
 Exploration & description Firstly, let us look at some of the patterns in the data. The tabular output results from the steps Stats → Summary Statistics → Summaries by Groups (Tabulation...) and the production of the dialog box shown alongside.
The output includes the frequency distribution of recorded weaning weight by genotype. Animals that died before weaning or a few whose weaning weights were not recorded are excluded from 'Nobserved'. The total number of lambs born can be obtained with Stats → Summary → Statistics Frequency Tables... Note that there are half the numbers of lambs at weaning for the RD genotype compared with the others.
|
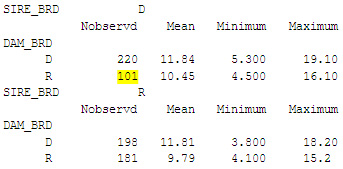 Note that there are half the numbers of lambs at weaning for the RD genotype compared with the others; also that the largest proportion of losses ((310-220)/310)=0.29 is for pure Dorper lambs compared with ((215-181)/215)=0.16 for pure Red Maasai lambs.
![]()
![]()
![]()