|
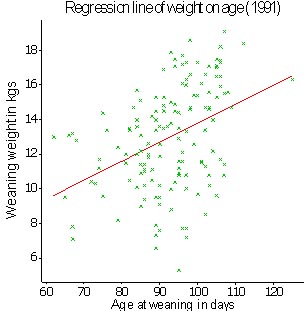
Exploration & description By similarly restricting the data to 1992 a second scatter plot is produced. This can be repeated for 1993, and so on. It can similarly be shown that there are similar patterns for the other four years. Age at weaning is therefore proposed for inclusion in the model as a continuous covariate in order to correct for its effect on weaning weight. |
|
![]()
![]()
![]()