|
Exploration & description
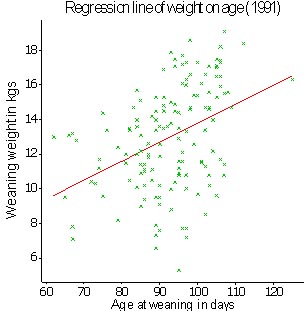
By similarly restricting the data to 1992 a
second scatter plot is produced.This can be repeated for
1993, and so on. It can similarly be shown that there are similar patterns for
the other four years. Age at weaning is therefore proposed for inclusion in the
model as a continuous covariate in order to correct for its effect on weaning
weight.
|
|
 |
In summary, we can deduce that the statistical model to be
fitted needs to include terms for year, age of dam (either as fixed effects or
as a polynomial regression) and a linear term for age at weaning. We have not
compared weaning weights of male and female lambs but it is well known that male
lambs grow faster than females. Thus, sex will invariably be included in a model
such as this.
|