Statistical modellingStudy A To undertake a cluster analysis we use Stats → Multivariate Analysis → Cluster Analysis → Hierarchical… A hierarchical
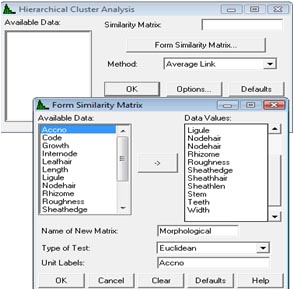
cluster is There are different clustering methods that can be applied that can result in slight differences in the final result, but we have chosen the 'Average link' method. Clicking the Options… button allows us to enter Accno to label the dendogram shown on the next page. We need to first create a similarity matrix which we can do by clicking the Form Similarity Matrix… button and then putting the fourteen variables into the Data Values: window and the accession code into the Unit Labels box. We need to give a name to the matrix and we choose the name 'Morphological'. There are several methods for defining similarity coefficients. We shall keep the default Euclidean Method which is generally suitable for quantitative variables. |
 developed by each accession first being defined as its own cluster. The two closest clusters are then merged into
one larger cluster, and this continues until finally all the accessions have been formed into a single cluster. This process,
as shown on the next page, is represented by a hierarchical tree with each node indicating the merges that occur at each step.
developed by each accession first being defined as its own cluster. The two closest clusters are then merged into
one larger cluster, and this continues until finally all the accessions have been formed into a single cluster. This process,
as shown on the next page, is represented by a hierarchical tree with each node indicating the merges that occur at each step.![]()
![]()
![]()