|
Exploration and description
River variables
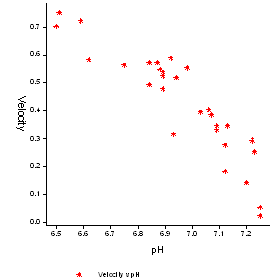 We now need to compare water flow velocity and pH. The scatter plot shows that the two variables are approximately linearly related. If we sort the data (Spread
  Sort...) into descending values of velocity we can see,
from the earlier graphs, that the velocity and
pH values (approximately < 0.4 and > 7 m/s, respectively) that are associated with changes in NBiom tend to be in records 17 to 30.
Sort...) into descending values of velocity we can see,
from the earlier graphs, that the velocity and
pH values (approximately < 0.4 and > 7 m/s, respectively) that are associated with changes in NBiom tend to be in records 17 to 30.
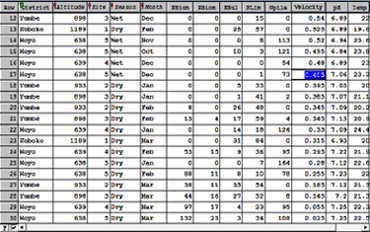
We shall save these records in CS14Data3 for subsequent regression
analysis under Statistical modelling by selecting and deleting rows 1-16
(Spread
Delete Selected
rows).
|