|
 Exploration and description Exploration and description
Human infections
We shall begin by summarising in two-way tables the average percentage of individuals
found
to be infected each month, namely P_infected (calculated from N_age_gen and N_infections).
Using Stats →
Summary Statistics →
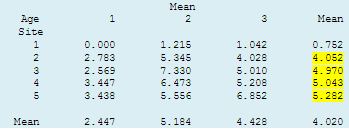
Summaries of Groups (Tabulation)... 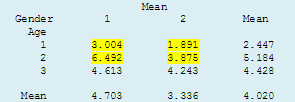 we first obtain a table of means by age and site.
Comparing the overall site means we can see that less than 1% of samples per month were infected in Site 1,
whereas between 4% and 5.3% of people were infected per month in the other four sites. These latter values would appear
to be too close to each other to be significantly different. Percentages in Age group 2 - adolescents (5.2%) and in Age group
3 - adults (4.3%) were higher than in Age group 1 - children (2.4%). we first obtain a table of means by age and site.
Comparing the overall site means we can see that less than 1% of samples per month were infected in Site 1,
whereas between 4% and 5.3% of people were infected per month in the other four sites. These latter values would appear
to be too close to each other to be significantly different. Percentages in Age group 2 - adolescents (5.2%) and in Age group
3 - adults (4.3%) were higher than in Age group 1 - children (2.4%).
 The two-way table by age and gender indicates that fewer female children and adolescents (Gender 2)
tended to be infected than their male counterparts (Gender 1), but that infection rates in adults were similar. The two-way table by age and gender indicates that fewer female children and adolescents (Gender 2)
tended to be infected than their male counterparts (Gender 1), but that infection rates in adults were similar.
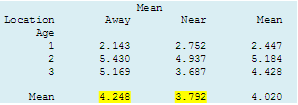
The two-way table by age and location shows that distance from the river had little impact on disease prevalence.
We are now ready to fit models to the data (see Statistical modelling). Because hardly any infection was detected in Site 1
we shall ignore this site and fit parameters for age and gender to the other four sites.
|