|
Exploration and description Snail and human infectionsPercentages of humans infected each month at each site are contained in the variable
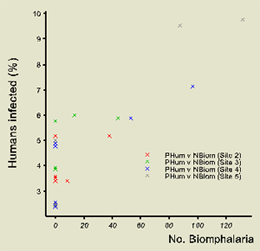
Phum contained in CS14Data1 alongside the river variables. Excluding Site 1 in which no snails were found,
a scatter plot is shown alongside (achieved via Graphs It can be seen that as the number of snails increases there is a tendency for the numbers of humans detected positive to increase too. This is especially the case in Site 4 and Site 5 where numbers of snails found during the dry season showed the greatest increase. This indicates a potential link between increases in the population of snails down river during the dry season and the incidence of new infections detected in humans. There is little more that one can do with these data except investigate the monthly incidence of infections among individuals to see which ones were likely to be persistent and which ones were likely to be new infections. Unfortunately, these data have been lost. The graph shows the monthly prevalence levels to be somewhat low; this is puzzling in view of the endemic nature of the disease in the region. What has not been mentioned is that the Government conducted a mass chemotherapy programme in the region a year earlier to de-worm communities. This is likely to have influenced the results of this study. Also not everyone who is infected with bilharzia will show clinical signs. |
![]()
![]()
![]()