 Statistical modelling Statistical modelling
Plant yield (plant height)
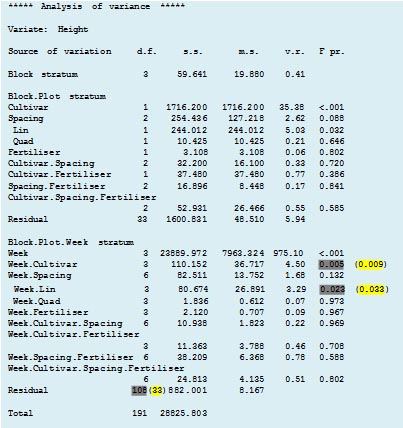
Now consider the sub-plot component of the analysis of variance. The printed F-probabilities are shown in grey,
but these are based on 108 degrees of freedom, which, as described earlier, are applicable to a split-plot, not a split-plot in time design.
For a split-plot in time analysis we apply the conservative method of recalculating the F-values by using the same 33
degrees of freedom shown in the main plot stratum also for the subplot stratum.
Thus, the F-values in yellow have been recalculated with 33 degrees of freedom for the denominator. These probabilities
can be seen to be slightly higher than the original values, although in this example the significance levels remain as P<0.01 and P<0.05, respectively, and so are not changed.
|