|
Statistical modelling Plant yield (plant height)
However, let us proceed assuming all is well. (Alternative solutions will be discussed later.) It can be seen that Umtata (C0) is shorter than Kranskop (C1) and that the linear (though not the proportional) difference in height between the two cultivars has gradually increased over time. Similarly, the relative decrease in plant height with increased spacing also increases over time. The standard errors featuring in this table have been abstracted from the GenStat output and placed below the means. Multiplying them by 2 gives approximate least significant differences (LSDs) (P<0.05) for comparisons within each week. Thus, the L.S.D. for spacing is 2 x 1.010 = 2.02. It can be seen that a significant difference in spacing (P<0.05) begins to occur in the third week. |
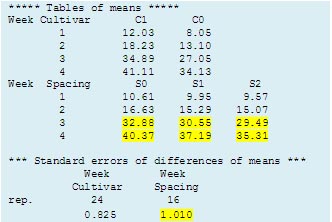 With the knowledge that significant interactions have been highlighted between week and cultivar and between
week and spacing we can now study two-way tables of means. The first thing that one should notice is that there is a
rapid increase in height over the 4-week period. It is likely that the variation in plant height has increased too, and,
if so, this could invalidate the combined analysis of variance for the four weeks. We should have carried out an exploratory analysis first!! – see
With the knowledge that significant interactions have been highlighted between week and cultivar and between
week and spacing we can now study two-way tables of means. The first thing that one should notice is that there is a
rapid increase in height over the 4-week period. It is likely that the variation in plant height has increased too, and,
if so, this could invalidate the combined analysis of variance for the four weeks. We should have carried out an exploratory analysis first!! – see
![]()
![]()
![]()