|
Statistical modelling Plant yield (plant height)The full GenStat output provides two standard errors for differences between means. One is for
comparison between subplots across main plots and one for comparison between subplots within the
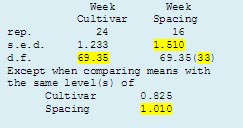
GenStat also calculates, as shown here, a composite number of degrees of freedom (namely 69.35) from the main plot and subplot residual degrees of freedom. However, as we are dealing with a split-plot in time analysis, not a conventional split-plot, the composite value becomes 33 anyway. The problem that we have been ignoring (investigated in Study question 3) is that the residual variance increases with increases in plant height from week 1 to 4; so this rather invalidates the analysis that we have been carrying out. So what can we do? Study question 4 provides one solution by calculating linear and quadratic components for week which can then be analysed separately using the simpler randomised block model. This approach for dealing with repeated measurements (i.e. expressing variations over time in terms of one or two linear functions of the repeated measure) is also described in Biometrics Unit, ILRI (2005) for the analysis of body weight and packed cell volume measured over time in a pilot vaccine experiment in cattle. |
 same main plot.
Thus, for week x spacing the standard errors are 1.510 for comparisons across main plots and 1.010 (as used for
the calculation of the L.S.D. on the previous page) for comparisons within a main plot.
same main plot.
Thus, for week x spacing the standard errors are 1.510 for comparisons across main plots and 1.010 (as used for
the calculation of the L.S.D. on the previous page) for comparisons within a main plot.
![]()
![]()
![]()